using System.Linq;
using System.Threading.Tasks;
using Microsoft.AspNetCore.Mvc;
+using System.Threading;
namespace testwebapi.Controllers
{
[ApiController]
public class DiagScenarioController : ControllerBase
{
+ object o1 = new object();
+ object o2 = new object();
- private static Processor p = new Processor();
+
+
+ private static Processor p = new Processor();
+
+ [HttpGet]
+ [Route("deadlock/")]
+ public ActionResult<string> deadlock()
+ {
+ (new System.Threading.Thread(() => {
+ DeadlockFunc();
+ })).Start();
+
+ Thread.Sleep(5000);
+
+ Thread[] threads = new Thread[300];
+ for(int i=0; i<300;i++)
+ {
+ (threads[i] = new Thread(() => {
+ lock (o1) {Thread.Sleep(100);}
+ })).Start();
+ }
+
+ foreach(Thread thread in threads)
+ {
+ thread.Join();
+ }
+
+ return "success:deadlock";
+ }
+
+ private void DeadlockFunc()
+ {
+ lock (o1)
+ {
+ (new Thread(() => {
+ lock (o2) { Monitor.Enter(o1); }
+ })).Start();
+
+ Thread.Sleep(2000);
+ Monitor.Enter(o2);
+ }
+ }
+
+
+ [HttpGet]
+ [Route("memspike/{seconds}")]
+ public ActionResult<string> memspike(int seconds)
+ {
+ Stopwatch watch=new Stopwatch();
+ watch.Start();
+
+ while(true)
+ {
+ p = new Processor();
+ watch.Stop();
+ if(watch.ElapsedMilliseconds > seconds*1000)
+ break;
+ watch.Start();
+
+ int it = (200000*1000) / 100;
+ for(int i=0; i<it; i++)
+ {
+ p.ProcessTransaction(new Customer(Guid.NewGuid().ToString()));
+ }
+
+ Thread.Sleep(5000); // Sleep for 5 seconds before cleaning up
+
+ // Cleanup
+ p = null;
+ GC.Collect();
+ GC.Collect();
+
+ Thread.Sleep(5000); // Sleep for 5 seconds before spiking memory again
+ }
+
+
+ return "success:memspike";
+ }
[HttpGet]
[Route("memleak/{kb}")]
--- /dev/null
+# App is experiencing intermittent memory spikes
+
+**IMPORTANT: This tutorial uses API/methods available in dotnet core preview 5. These API/methods are _subject to change._**
+
+http://localhost:5000/api/diagscenario/memspike/{seconds}
+
+In this scenario, the endpoint will experience intermittent memory spikes over the specified number of seconds. Memory will go from base line to spike and back to baseline several times. What makes this scenario different from the memory leak scenario is that we will have to figure out a way to automatically trigger the collection of a dump when the memory spikes.
+
+### Memory counters
+Before we dig into collecting diagnostics data to help us root cause this scenario, we need to convince ourselves that what we are seeing is an intermittent memory spike. To help with this we can use the dotnet-counters tool which allows us to watch the memory usage for a selected dotnet process (please see [Installing the diagnostics tools](installing_the_diagnostics_tools.md)).
+
+Let's run the webapi (dotnet run) and before navigating to the above URL (specifying 300 seconds) check our managed memory counters:
+
+> ```bash
+> dotnet-counters monitor --refresh-interval 1 -p 4807
+> ```
+
+4807 is the process identifier which can be found using dotnet-trace list-processes. The refresh-interval is the number of seconds before refreshes.
+
+The output should be similar to the below:
+
+
+
+Here we can see that right after startup, the managed heap memory is 4MB.
+
+Now, let's navigate to the URL (http://localhost:5000/api/diagscenario/memspike/300) which will run for 5 minutes giving us ample time to experiment.
+
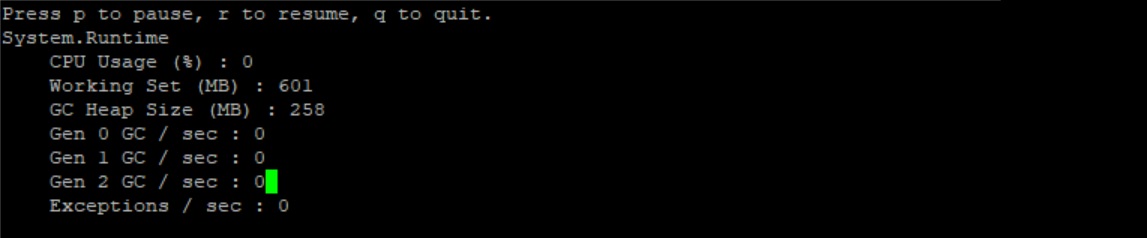
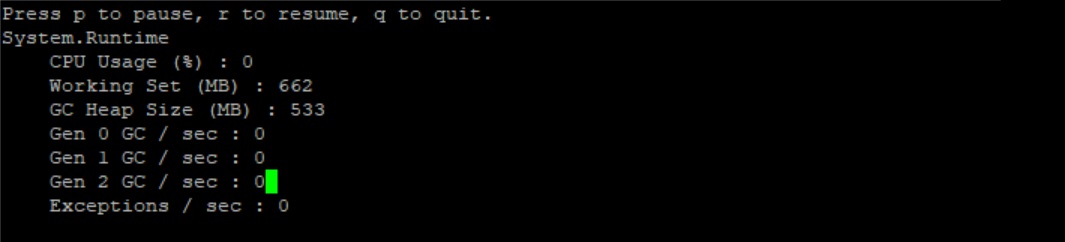
+Re-run the dotnet-counters command. We should see an alternating heap size with a baseline of roughly 250MB and the highest spike around 630MB. The memory usage will alternate between baseline and spike every 5 seconds or so.
+
+Baseline:
+
+
+High:
+
+
+At this point, we can safely say that memory is spiking to a high that is not normal and the next step is to run a collection tool that can help us collect the right data at the right time.
+
+
+### Core dump generation
+Let's step back a bit and revisit the high memory scenario earlier in the tutorial. In that scenario, memory grew high and stayed high allowing us the opportunity to run the dotnet-dump command without restriction. However, in our current scenario we have a short memory spike that only lasts about 5 seconds per spike. This makes it difficult to get setup to run the dotnet-dump tool manually. What we would preferably like is a tool that could monitor the dotnet core counters and automatically create a core dump once a threshold has been breached. This is a perfect opportunity to start exploring how we can write our own diagnostics tools to cater to our diagnostics needs.
+
+What we would like this tool to do is allow the user to specify the pid of the target process as well as the memory consumption threshold (in MBs). It would then continuously monitor the process and create a dump if the threshold is breached:
+
+> ```bash
+> sudo ./triggerdump <pid> <memory threshold in MBs>
+> ```
+
+#### Some background before we start writing the tool...
+The dotnet core runtime contains a mechanism known as the EventPipe that carries events to interested consumers. There are several different events that flow through the EventPipe including diagnostics information such as counters. The EventPipe is exposed as a Unix domain socket on Linux machines and named pipes on Windows. EventPipe is set to duplex mode which means that clients can both read and write to the pipe. A diagnostics application can register to consume these events from the EventPipe and create new diagnostics experiences. Rather than communicating directly with EventPipe there is a client library that can be used and implemented in Microsoft.Diagnostics.Tools.RuntimeClient.dll.
+
+Events that are written to the EventPipe can come from multiple sources (or providers) and as such, clients that receive events over EventPipe can filter those events based on specific providers.
+
+#### Writing the tool...
+We have two requirements in order to implement a tool that will create a dump file based on memory consumption:
+
+* Read dotnet memory counter to know if the current memory consumptions goes above the specified threshold
+* Generate the actual core dump
+
+Let's start with the first requirement, reading dotnet counters. As explained earlier, we can use the EventPipe mechanism to read counters from the runtime. In this case, the provider that writes counter events is System.Runtime.
+
+[Full code](src/triggerdump/Program.cs)
+
+Below is the releveant code snippet that is required to consume the counters:
+
+```csharp
+Task monitorTask = new Task(() =>
+{
+ var prov = new List<Provider>();
+ prov.Add(new Provider("System.Runtime", filterData:"EventCounterIntervalSec=1"));
+
+ var configuration = new SessionConfiguration(
+ circularBufferSizeMB: 1000,
+ outputPath: "",
+ providers: prov);
+
+ var binaryReader = EventPipeClient.CollectTracing(Int32.Parse(args[0]), configuration, out _sessionId);
+ EventPipeEventSource source = new EventPipeEventSource(binaryReader);
+ source.Dynamic.All += Dynamic_All;
+ source.Process();
+});
+```
+
+The above code first creates the configuration and specifying the buffer size, output path and finally the System.Runtime provider that we are interested in. Next, it calls the CollectTracing method specifying the process identifier we are interested in tracing, the configuration and an out session ID. Once that is completed, we create an EventPipeSource from the reader created in the previous step and attach a callback that will be invoked as the events are delivered over EventPipe. Last, we call the Process method to start processing the events. At this point, the Dynamic_All method will be invoked anytime an event comes through from the System.Runtime provider.
+
+Now that we have the events flowing through out callback, let's turn our attention to the callback itself and how we can get the counter information:
+
+```csharp
+private static void Dynamic_All(TraceEvent obj)
+{
+ if (obj.EventName.Equals("EventCounters"))
+ {
+ IDictionary<string, object> payloadVal = (IDictionary<string, object>)(obj.PayloadValue(0));
+ IDictionary<string, object> payloadFields = (IDictionary<string, object>)(payloadVal["Payload"]);
+
+ ICounterPayload payload = payloadFields.Count == 6 ? (ICounterPayload)new IncrementingCounterPayload(payloadFields) : (ICounterPayload)new CounterPayload(payloadFields);
+ string displayName = payload.GetDisplay();
+ if (string.IsNullOrEmpty(displayName))
+ {
+ displayName = payload.GetName();
+ }
+
+ if(string.Compare(displayName, "GC Heap Size") == 0 && Convert.ToInt32(payload.GetValue())>threshold)
+ {
+ // Generate dump and exit
+ }
+ }
+}
+```
+Every time the callback is invoked, a TraceEvent is recieved. The TraceEvent contains information about the event that was delivered. In our case, the first thing we do is to make sure the event corresponds to EventCounters. If so, we get the GC Heap Size counter from the event payload and compare it to the threshold that the user set as part of the command line invocation. If the threshold was breached, we are ready to generate a dump.
+
+The last step of the puzzle is to generate the dump. For brevity, we will focus only on core dump generation on Linux. In preview 5, the way to generate a core dump is to invoke the createdump tool that ships with the runtime. Add the following code to the Dynamic_All method (replacing the Generate dump and exit comment):
+
+
+```csharp
+Console.WriteLine("Memory threshold has been breached....");
+System.Diagnostics.Process process = System.Diagnostics.Process.GetProcessById(pid);
+
+System.Diagnostics.ProcessModule coreclr = process.Modules.Cast<System.Diagnostics.ProcessModule>().FirstOrDefault(m => string.Equals(m.ModuleName, "libcoreclr.so"));
+if (coreclr == null)
+{
+ Console.WriteLine("Unable to locate .NET runtime associated with this process!");
+ Environment.Exit(1);
+}
+else
+{
+ string runtimeDirectory = Path.GetDirectoryName(coreclr.FileName);
+ string createDumpPath = Path.Combine(runtimeDirectory, "createdump");
+ if (!File.Exists(createDumpPath))
+ {
+ Console.WriteLine("Unable to locate 'createdump' tool in '{runtimeDirectory}'");
+ Environment.Exit(1);
+ }
+
+ var createdump = new System.Diagnostics.Process()
+ {
+ StartInfo = new System.Diagnostics.ProcessStartInfo()
+ {
+ FileName = createDumpPath,
+ Arguments = $"--name coredump --withheap {pid}",
+ },
+ EnableRaisingEvents = true,
+ };
+
+ createdump.Start();
+ createdump.WaitForExit();
+
+ Environment.Exit(0);
+}
+```
+
+We can now build the tool (dotnet build) and run it against our application. Once built, restart the test webapi, get the process id from dotnet-trace and run triggerdump:
+
+> ```bash
+> dotnet-trace list-processes
+> ...
+> 80926 webapi /home/marioh/webapi/bin/Debug/netcoreapp3.0/webapi
+> sudo dotnet triggerdump.dll 80926 500
+> ```
+
+Please note that triggerdump has to be run with sudo. The invocation tells triggerdump to monitor process with a process id of 80926 and to create dump when memory grows above 500MB.
+
+At this point, you should see triggerdump waiting/monitoring the memory counter. Let's trigger the intermittent memory spike by navigating to:
+
+http://localhost:5000/api/diagscenario/memspike/300
+
+After 10-15 seconds, you will notice that triggerdump outputs the following followed by exiting.
+
+> ```bash
+> ...
+> Writing minidump with heap to file coredump
+> Written 820518912 bytes (200322 pages) to core file
+> ```
+
+That's it for creating your own diagnostics tool to solve the intermittent memory spike scenario!
+
+### Analyzing the core dump
+Since the core dump that our tool generates is a standard core dump, we can use the same techniques illustrated in [Scenario - App is leaking memory](app_is_leaking_memory_eventual_crash.md) to analyze the dump and find out why we're seeing intermittent high memory conditions.
+
+
+
+
+
--- /dev/null
+using Microsoft.Diagnostic.Repl;
+using Microsoft.Diagnostics.Runtime;
+using System.CommandLine;
+using System.Linq;
+using System.Threading.Tasks;
+using System.Collections.Generic;
+using System.Text;
+
+namespace Microsoft.Diagnostic.Tools.Dump
+{
+ internal class Stack
+ {
+ public List<uint> threadIds = new List<uint>();
+ }
+
+
+ [Command(Name = "uniquestacks", Help = "Displays the unique managed stacks.")]
+ [CommandAlias(Name = "us")]
+ public class UniqueStacksCommand : CommandBase
+ {
+ [Option(Name = "--verbose", Help = "Displays more details.")]
+ [OptionAlias(Name = "-v")]
+ public bool Verbose { get; set; }
+
+ public AnalyzeContext AnalyzeContext { get; set; }
+
+ public override Task InvokeAsync()
+ {
+ Dictionary<string, Stack> threads = new Dictionary<string, Stack>();
+
+ foreach (ClrThread thread in AnalyzeContext.Runtime.Threads)
+ {
+ if (!thread.IsAlive) continue;
+
+ StringBuilder completeStack = new StringBuilder();
+ foreach (ClrStackFrame frame in thread.StackTrace)
+ {
+ //Console.WriteLine("{0,16:X} {1,16:X} {2}", frame.StackPointer, frame.InstructionPointer, frame.DisplayString);
+ completeStack.Append(frame.StackPointer + " " + frame.InstructionPointer + " " + frame.DisplayString + "\n");
+ }
+
+ string cStack = completeStack.ToString();
+
+ if(threads.ContainsKey(cStack)==true)
+ {
+ threads[cStack].threadIds.Add(thread.OSThreadId);
+ }
+ else
+ {
+ Stack s = new Stack();
+ s.threadIds.Add(thread.OSThreadId);
+ threads.Add(cStack, s);
+ }
+ }
+
+ foreach (KeyValuePair<string, Stack> item in threads)
+ {
+ System.Console.WriteLine(item.Key);
+ System.Console.WriteLine("\n\n");
+ }
+
+ return Task.CompletedTask;
+ }
+ }
+}
\ No newline at end of file