> dotnet trace collect --process-id 1902
Recording trace 107MB
Recording complete
- Trace complete: ~/trace.netperf
+ Trace complete: ~/trace.nettrace
**Convert a trace to use with speedscope**
- > dotnet trace convert ~/trace.netperf --to-speedscope
+ > dotnet trace convert ~/trace.nettrace --to-speedscope
Writing: ~/trace.speedscope.json
Conversion complete
Show command line help
-o, --output
- The output path for the collected trace data. If not specified it defaults to ./trace.netperf
+ The output path for the collected trace data. If not specified it defaults to ./trace.nettrace
--profile
A named pre-defined set of provider configurations that allows common tracing scenarios to be specified
Sets the size of the in-memory circular buffer in megabytes. Default 256 MB.
--format
- The format of the output trace file. The default value is netperf.
+ The format of the output trace file. The default value is nettrace.
Examples:
using the same base filename as the input file and the extension appropriate for the new format.
--format
- Specifies the format to convert the netperf file to. Currently, the only valid input is 'speedscope'.
+ Specifies the format to convert the nettrace file to. Currently, the only valid input is 'speedscope'.
trace_file_path
- The path to the trace file that should be converted. The trace file can be a netperf file. Defaults to 'trace.netperf'.
+ The path to the trace file that should be converted. The trace file can be a nettrace file. Defaults to 'trace.nettrace'.
Examples:
- > dotnet-trace convert trace.netperf -f speedscope
+ > dotnet-trace convert trace.nettrace -f speedscope
Writing: ./trace.speedscope.json
Conversion complete
Recording trace 107MB
Recording complete (process exited)
Packing...
- Trace complete: ~/trace.netperf.zip
+ Trace complete: ~/trace.nettrace.zip
VERB
Examples:
- > dotnet-trace pack trace.netperf
- Packing: ./trace.netperf.zip
+ > dotnet-trace pack trace.nettrace
+ Packing: ./trace.nettrace.zip
Pack complete
- > dotnet-trace pack --verbose trace.netperf
- Packing: /usr/home/noahfalk/trace.netperf.zip
- Compressing /usr/home/noahfalk/trace.netperf
+ > dotnet-trace pack --verbose trace.nettrace
+ Packing: /usr/home/noahfalk/trace.nettrace.zip
+ Compressing /usr/home/noahfalk/trace.nettrace
Checking /usr/bin/dotnet/shared/3.0.170/System.Private.CoreLib.dll
Not packing symbols - Policy skips Microsoft binary
Checking /usr/bin/dotnet/shared/3.0.170/System.Diagnostics.dll
```
runtime <- client : [ magic; size; EventPipe CollectTracing ][ stream config struct ] <- Diagnostic IPC Message
runtime -> client : [ magic; size; Server OK ][ sessionId ] <- Diagnostic IPC Message
-runtime -> client : [ stream of netperf data ] <- Optional Continuation
+runtime -> client : [ stream of nettrace data ] <- Optional Continuation
// stop message is sent on another connection
<td colspan="2">0x0000</td>
<td colspan="4">250</td>
<td colspan="4">16</td>
- <td colspan="16">"/tmp/foo.netperf"</td>
+ <td colspan="16">"/tmp/foo.nettrace"</td>
<td colspan="4">1</td>
<td colspan="8">100</td>
<td colspan="4">2</td>
Command Code: `0x0202`
-The `CollectTracing` Command is used to start a streaming session of event data. The runtime will attempt to start a session and respond with a success message with a payload of the `sessionId`. The event data is streamed in the `netperf` format. The stream begins after the response Message from the runtime to the client. The client is expected to continue to listen on the transport until the connection is closed.
+The `CollectTracing` Command is used to start a streaming session of event data. The runtime will attempt to start a session and respond with a success message with a payload of the `sessionId`. The event data is streamed in the `nettrace` format. The stream begins after the response Message from the runtime to the client. The client is expected to continue to listen on the transport until the connection is closed.
In the event there is an [error](#Errors), the runtime will attempt to send an error message and subsequently close the connection.
The client is expected to send a [`StopTracing`](#StopTracing) command to the runtime in order to stop the stream, as there is a "run down" at the end of a stream session that transmits additional metadata.
-If the stream is stopped prematurely due to a client or server error, the `netperf` file generated will be incomplete and should be considered corrupted.
+If the stream is stopped prematurely due to a client or server error, the `nettrace` file generated will be incomplete and should be considered corrupted.
#### Inputs:
Header: `{ Magic; Size; 0x0202; 0x0000 }`
* `uint circularBufferMB`: The size of the circular buffer used for buffering event data while streaming
+* `uint format`: 0 for the legacy NetPerf format and 1 for the NetTrace format
* `string outputPath`: currently unused, and should be 0 length
* `array<provider_config> providers`: The providers to turn on for the streaming session
ulong sessionId
}
```
-Followed by an Optional Continuation of a `netperf` format stream of events.
+Followed by an Optional Continuation of a `nettrace` format stream of events.
### `StopTracing`
-----
### Current Implementation (OLD)
-Single-purpose IPC protocol used exclusively for EventPipe functionality. "Packets" in the current implementation are simply the `netperf` payloads and command/control is handled via `uint32` enum values sent one way with hard coded responses expected.
+Single-purpose IPC protocol used exclusively for EventPipe functionality. "Packets" in the current implementation are simply the `nettrace` payloads and command/control is handled via `uint32` enum values sent one way with hard coded responses expected.
```c++
enum class DiagnosticMessageType : uint32_t
Press <Enter> to exit...
Connecting to process: <Full-Path-To-Process-Being-Profiled>/dotnet.exe
-Collecting to file: <Full-Path-To-Trace>/trace.netperf
+Collecting to file: <Full-Path-To-Trace>/trace.nettrace
Session Id: <SessionId>
Recording trace 721.025 (KB)
```
-- Finally, stop collection by pressing the \<Enter> key, and *dotnet-trace* will finish logging events to *trace.netperf* file.
+- Finally, stop collection by pressing the \<Enter> key, and *dotnet-trace* will finish logging events to *trace.nettrace* file.
## Viewing the trace captured from dotnet-trace
-On Windows, `.netperf` files can be viewed on PerfView (https://github.com/microsoft/perfview) for analysis, just like traces collected with ETW or LTTng. For traces collected on Linux, you can either move the trace to a Windows machine to be viewed on PerfView.
+On Windows, `.nettrace` files can be viewed on PerfView (https://github.com/microsoft/perfview) for analysis, just like traces collected with ETW or LTTng. For traces collected on Linux, you can either move the trace to a Windows machine to be viewed on PerfView.
-If you would rather view the trace on a Linux machine, you can do this by changing the output format of `dotnet-trace` to `speedscope`. You can change the output file format using the `-f|--format` option - `-f speedscope` will make `dotnet-trace` to produce a speedscope file. You can currently choose between `netperf` (the default option) and `speedscope`. Speedscope files can be opened at https://www.speedscope.app.
+If you would rather view the trace on a Linux machine, you can do this by changing the output format of `dotnet-trace` to `speedscope`. You can change the output file format using the `-f|--format` option - `-f speedscope` will make `dotnet-trace` to produce a speedscope file. You can currently choose between `nettrace` (the default option) and `speedscope`. Speedscope files can be opened at https://www.speedscope.app.
-Note: The .NET Core runtime generates traces in the `netperf` format, and are converted to speedscope (if specified) after the trace is completed. Since some conversions may result in loss of data, the original `netperf` file is preserved next to the converted file.
+Note: The .NET Core runtime generates traces in the `nettrace` format, and are converted to speedscope (if specified) after the trace is completed. Since some conversions may result in loss of data, the original `nettrace` file is preserved next to the converted file.
## Known Caveats
The process to collect the trace from
-o, --output <trace-file-path>
- The output path for the collected trace data. If not specified it defaults to 'trace.netperf'
+ The output path for the collected trace data. If not specified it defaults to 'trace.nettrace'
--profile
A named pre-defined set of provider configurations that allows common tracing scenarios to be specified
Sets the size of the in-memory circular buffer in megabytes. Default 256 MB.
-f, --format
- The format of the output trace file. This defaults to "netperf" on Windows and "speedscope" on other OSes.
+ The format of the output trace file. This defaults to "nettrace" on Windows and "speedscope" on other OSes.
> dotnet-trace collect -p 2266 --providers Microsoft-DotNETCore-SampleProfiler
> ```
-2266 is the process identifier which can be found using dotnet-trace list-processes. Let dotnet-trace run for about 20-30 seconds and then hit enter to exit the collection. The result is a netperf file located in the same folder. netperf files are a great way to use existing analysis tools on Windows (such as PerfView) to diagose performance problems.
+2266 is the process identifier which can be found using dotnet-trace list-processes. Let dotnet-trace run for about 20-30 seconds and then hit enter to exit the collection. The result is a nettrace file located in the same folder. nettrace files are a great way to use existing analysis tools on Windows (such as PerfView) to diagose performance problems.
-Alternatively, you can get the perf and LTTng trace data in netperf format by using the perfcollect tool (please see Installing the tools section). Once installed, run the following command:
+Alternatively, you can get the perf and LTTng trace data in nettrace format by using the perfcollect tool (please see Installing the tools section). Once installed, run the following command:
> ```bash
> sudo ./perfcollect collect sampleTrace
This will start the perf collection process. Let it run for about 20-30 seconds and then hit CTRL-C to exit the collection process. The output should tell you how many MBs of perf data was written.
### Analyzing the trace
-When it comes to analyzing the profiler trace generated in the previous step, you have two options depending on if you generated a netperf file or used the native perf command in Linux.
+When it comes to analyzing the profiler trace generated in the previous step, you have two options depending on if you generated a nettrace file or used the native perf command in Linux.
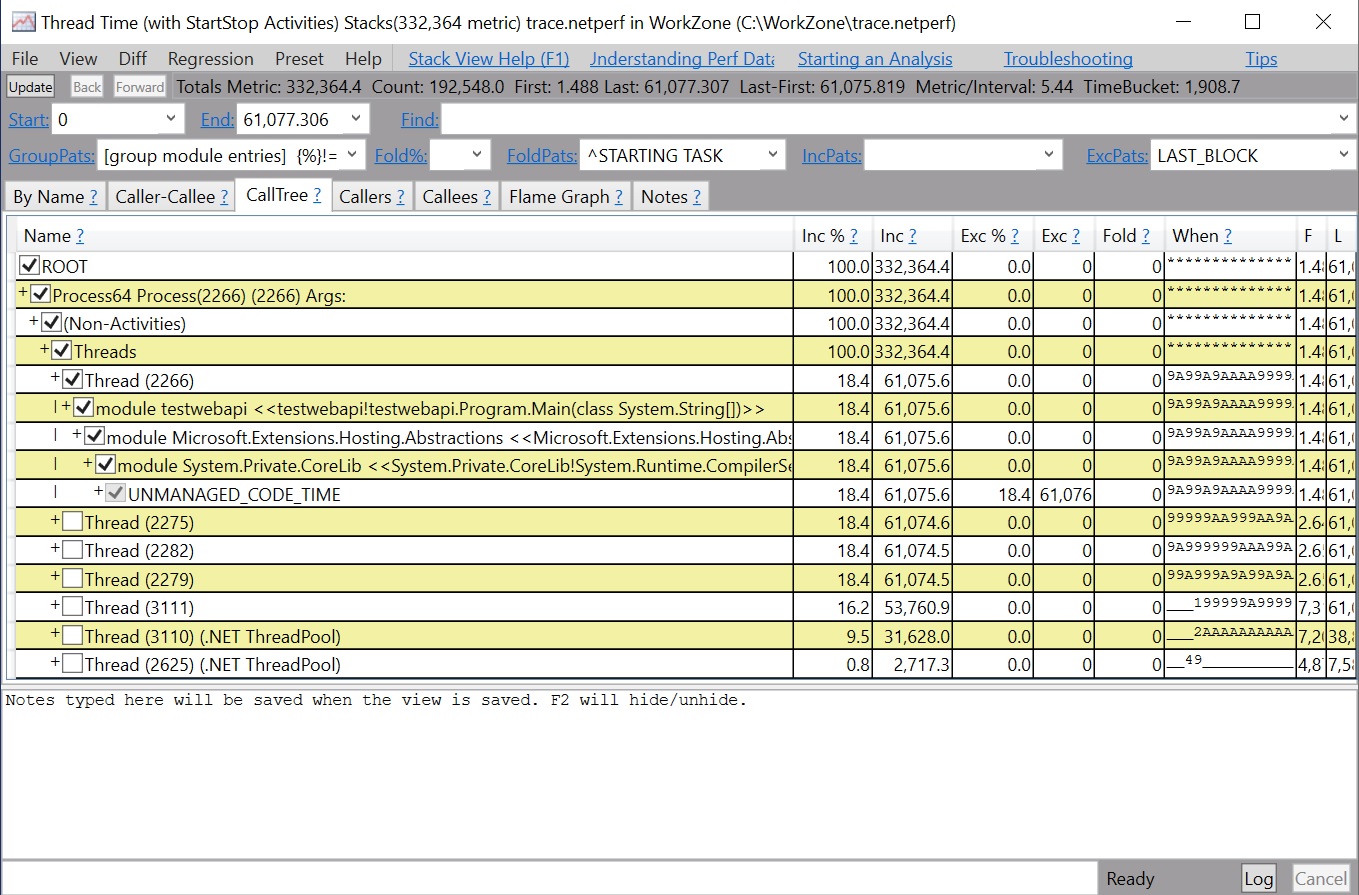
-Starting with the netperf file, you need to transfer the netperf file to a Windows machine and use PerfView to analyze the trace as shown below.
+Starting with the nettrace file, you need to transfer the nettrace file to a Windows machine and use PerfView to analyze the trace as shown below.
> ```
### perfcollect
-Thet .NET core runtime is instrumented for both perf and LTTng. To facilitate easier collection of both tracing technologies there is a tool called perfcollect. Perfcollect will output the joint trace data into a netperf file that can be analyzed using PerfView on Windows. To install the tool run the following commands:
+Thet .NET core runtime is instrumented for both perf and LTTng. To facilitate easier collection of both tracing technologies there is a tool called perfcollect. Perfcollect will output the joint trace data into a nettrace file that can be analyzed using PerfView on Windows. To install the tool run the following commands:
> ```
> curl -OL http://aka.ms/perfcollect
<MicrosoftSymbolStoreVersion>1.0.0-dev-64016-01</MicrosoftSymbolStoreVersion>
<MicrosoftDiagnosticsRuntimeVersion>1.0.5</MicrosoftDiagnosticsRuntimeVersion>
- <MicrosoftDiagnosticsTracingTraceEventVersion>2.0.41</MicrosoftDiagnosticsTracingTraceEventVersion>
+ <MicrosoftDiagnosticsTracingTraceEventVersion>2.0.43</MicrosoftDiagnosticsTracingTraceEventVersion>
<SystemCommandLineExperimentalVersion>0.2.0-alpha.19254.1</SystemCommandLineExperimentalVersion>
<SystemCommandLineRenderingVersion>0.2.0-alpha.19254.1</SystemCommandLineRenderingVersion>
namespace Microsoft.Diagnostics.Tools.RuntimeClient
{
+ public enum EventPipeSerializationFormat
+ {
+ NetPerf,
+ NetTrace
+ }
+
public struct SessionConfiguration
{
- public SessionConfiguration(uint circularBufferSizeMB, string outputPath, IReadOnlyCollection<Provider> providers)
+ public SessionConfiguration(uint circularBufferSizeMB, EventPipeSerializationFormat format, string outputPath, IReadOnlyCollection<Provider> providers)
{
if (circularBufferSizeMB == 0)
throw new ArgumentException($"Buffer size cannot be zero.");
+ if (format != EventPipeSerializationFormat.NetPerf && format != EventPipeSerializationFormat.NetTrace)
+ throw new ArgumentException("Unrecognized format");
if (providers == null)
throw new ArgumentNullException(nameof(providers));
if (providers.Count() <= 0)
throw new ArgumentException($"Specified output file name: {outputPath}, refers to a directory.");
CircularBufferSizeInMB = circularBufferSizeMB;
+ Format = format;
+ string extension = format == EventPipeSerializationFormat.NetPerf ? ".netperf" : ".nettrace";
_outputPath = outputPath != null ?
- new FileInfo(fileName: !outputPath.EndsWith(".netperf") ? $"{outputPath}.netperf" : outputPath) : null;
+ new FileInfo(fileName: !outputPath.EndsWith(extension) ? $"{outputPath}{extension}" : outputPath) : null;
_providers = new List<Provider>(providers);
}
public uint CircularBufferSizeInMB { get; }
+ public EventPipeSerializationFormat Format { get; }
public string OutputPath => _outputPath?.FullName;
using (var writer = new BinaryWriter(stream))
{
writer.Write(CircularBufferSizeInMB);
-
+ writer.Write((uint)Format);
writer.WriteString(OutputPath);
writer.Write(Providers.Count());
{
foreach (var file in Files)
{
- if (file.EndsWith(".netperf"))
+ if (file.EndsWith(".nettrace"))
{
console.WriteLine($"Loading trace: {file} ...");
var etlx = TraceLog.CreateFromEventPipeDataFile(file);
{
var configuration = new SessionConfiguration(
circularBufferSizeMB: 1000,
+ format: EventPipeSerializationFormat.NetTrace,
outputPath: "",
providers: Trace.Extensions.ToProviders(providerString));
var process = Process.GetProcessById(processId);
var configuration = new SessionConfiguration(
circularBufferSizeMB: buffersize,
+ format: EventPipeSerializationFormat.NetTrace,
outputPath: null, // Not used on the streaming scenario.
providers: providerCollection);
Console.Out.WriteLine();
Console.Out.WriteLine("Trace completed.");
- if (format != TraceFileFormat.Netperf)
+ if (format != TraceFileFormat.NetTrace)
TraceFileFormatConverter.ConvertToFormat(format, output.FullName);
return failed ? ErrorCodes.TracingError : 0;
argument: new Argument<uint>(defaultValue: DefaultCircularBufferSizeInMB) { Name = "size" },
isHidden: false);
- public static string DefaultTraceName => "trace.netperf";
+ public static string DefaultTraceName => "trace.nettrace";
private static Option OutputPathOption() =>
new Option(
{
public static int ConvertFile(IConsole console, FileInfo inputFilename, TraceFileFormat format, FileInfo output)
{
- if (format == TraceFileFormat.Netperf)
- throw new ArgumentException("Cannot convert to netperf format.");
+ if (format == TraceFileFormat.NetTrace)
+ throw new ArgumentException("Cannot convert to nettrace format.");
if (!inputFilename.Exists)
throw new FileNotFoundException($"File '{inputFilename}' does not exist.");
public static Command ConvertCommand() =>
new Command(
name: "convert",
- description: "Converts traces to alternate formats for use with alternate trace analysis tools. Can only convert from the netperf format.",
+ description: "Converts traces to alternate formats for use with alternate trace analysis tools. Can only convert from the nettrace format.",
argument: (new Argument<FileInfo>(defaultValue: new FileInfo(CollectCommandHandler.DefaultTraceName)) {
Name = "input-filename",
Description = $"Input trace file to be converted. Defaults to '{CollectCommandHandler.DefaultTraceName}'."
argument: new Argument<int> { Name = "pid" },
isHidden: false);
- public static TraceFileFormat DefaultTraceFileFormat => TraceFileFormat.Netperf;
+ public static TraceFileFormat DefaultTraceFileFormat => TraceFileFormat.NetTrace;
public static Option FormatOption() =>
new Option(
namespace Microsoft.Diagnostics.Tools.Trace
{
- internal enum TraceFileFormat { Netperf, Speedscope };
+ internal enum TraceFileFormat { NetTrace, Speedscope };
internal static class TraceFileFormatConverter
{
private static Dictionary<TraceFileFormat, string> TraceFileFormatExtensions = new Dictionary<TraceFileFormat, string>() {
- { TraceFileFormat.Netperf, "netperf" },
+ { TraceFileFormat.NetTrace, "nettrace" },
{ TraceFileFormat.Speedscope, "speedscope.json" }
};
switch (format)
{
- case TraceFileFormat.Netperf:
+ case TraceFileFormat.NetTrace:
break;
case TraceFileFormat.Speedscope:
ConvertToSpeedscope(fileToConvert, outputFilename);
uint circularBufferSizeMB = 64;
var filePath = Path.Combine(
Directory.GetCurrentDirectory(),
- $"dotnetcore-eventpipe-{ThisProcess.Id}.netperf");
+ $"dotnetcore-eventpipe-{ThisProcess.Id}.nettrace");
var providers = new[] {
new Provider(name: "Microsoft-Windows-DotNETRuntime"),
};
uint circularBufferSizeMB = 64;
var filePath = Path.Combine(
Directory.GetCurrentDirectory(),
- $"dotnetcore-eventpipe-{ThisProcess.Id}.netperf");
+ $"dotnetcore-eventpipe-{ThisProcess.Id}.nettrace");
var providers = new[] {
new Provider(name: "Microsoft-Windows-DotNETRuntime"),
};
Assert.Equal("EventPipe output file", File.Exists(filePath), true);
// Check file is valid.
- Console.WriteLine("Validating netperf file.");
- ValidateNetPerf(filePath);
+ Console.WriteLine("Validating nettrace file.");
+ ValidateNetTrace(filePath);
}
}
finally
}
}
- private static void ValidateNetPerf(string filePath)
+ private static void ValidateNetTrace(string filePath)
{
var nEventPipeResults = 0;
using (var trace = new TraceLog(TraceLog.CreateFromEventPipeDataFile(filePath)).Events.GetSource())
}
[Conditional("DEBUG")]
- private static void DumpNetPerf(string filePath)
+ private static void DumpNetTrace(string filePath)
{
using (var trace = new TraceLog(TraceLog.CreateFromEventPipeDataFile(filePath)).Events.GetSource())
{