--- /dev/null
+# .NET Core Diagnostics Overview
+
+With .NET Full running on Windows we have grown accustomed to a plethora of great diagnostics tools ranging from dump generation and manual analysis to more sophisticated collection engines such as DebugDiag. As .NET core is picking up (cross platform) steam what types of diagnostics capabilities are available to us when we need to do production diagnostics? It turns out that a lot of work has been done in this area and specifically .net core 3 promises to bring a wide range of diagnostics capabilities.
+
+To learn more about production diagnostics in .net core 3, we'll be running through a set of diagnostics scenarios using the built in runtime/sdk tools. The walkthroughs are all run on Ubuntu 16.04 and use the latest .net core preview bits.
+
+Before we jump in head first, let's take a look at some basic methodologies as it relates to production diagnostics. When an outage occurs in production, typically the first and foremost goal is mitigation. Mitigation typically involves getting the app back up and running as quickly as possible. Common mitigation techniques involve restarting the app or sometimes one or more nodes/servers. While restarting is a quick and effective mitigation technique, root cause of the failure is still expected to be understood and appropriate fix(es) made to avoid future downtime. In order to get to root cause, we need to collect as much diagnostics data as we can prior to executing the mitigation strategy. The diagnostics data collected can then be analyzed postmortem to determine root cause and possible fixes. Each of the scenarios we will explore here will outline what capabilities .net core 3 has in terms of diagnostics data collection and analysis.
+
+Below is the list of (growing) scenarios that will be covered.
+
+
+Most of the scenarios below are implemented using a simple webapi with methods that expose each particular scenario. You can easily create the webapi using:
+
+* dotnet new webapi
+* add diagscenario.cs to your Controllers folder
+* dotnet build
+
+Please note that you have to be using at least preview 5 for most of the capabilities to work.
+
+
+### [Installing the diagnostics tools](installing_the_diagnostics_tools.md)
+
+### [Scenario - App is leaking memory (eventual crash)](app_is_leaking_memory_eventual_crash.md)
+
+### [Scenario - App is running slow (due to high CPU)](app_running_slow_highcpu.md)
+
+### Scenario - App is experiencing intermittent exceptions
+
+
+
+
--- /dev/null
+# App is leaking memory (eventual crash/hang)
+
+http://localhost:5000/api/diagscenario/memleak/{kb}
+
+In this scenario, the endpoint will slowly start leaking memory (amount specified by {kb}) and eventually will result in an out of memory exception. In order to diagnose this scenario, we need several key pieces of diagnostics data.
+
+### Memory counters
+Before we dig into collecting diagnostics data to help us root cause this scenario, we need to convince ourselves that what we are actually seeing is a memory leak (memory growth). On Windows we could use the myriad of .NET performance counters, but what about on Linux? It turns out .net core has been instrumented to expose metrics from the runtime and we can use the dotnet-counters tool to get at this information (please see 'Installing the diagnostics tools' section).
+
+Next, lets run the webapi (dotnet run) and before hitting the above URL that will cause the leak, lets check our managed memory counters:
+
+> ```bash
+> dotnet-counters monitor gc-heap-size --refresh-interval 1 -p 4807
+> ```
+
+4807 is the process identifier which can be found using dotnet-trace list-processes. The refresh-interval is the number of seconds before refreshes.
+
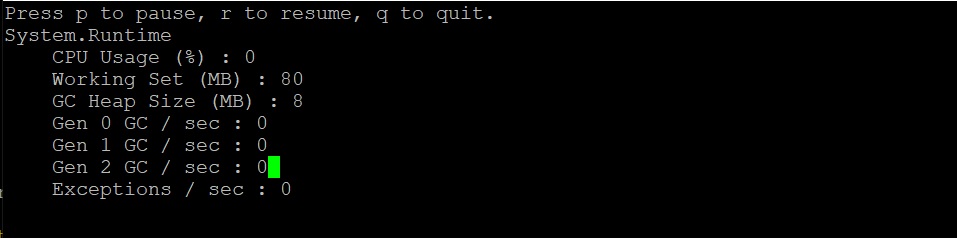
+The output should be similar to the below:
+
+
+
+Here we can see that right after startup, the managed heap memory is 4MB.
+
+Now, let's hit the URL (http://localhost:5000/api/diagscenario/memleak/200000)
+
+Re-run the dotnet-counters command. We should see an increase in memory usage as shown below:
+
+
+
+Memory has now grown to around 265MB.
+
+Note that this shows all the counters. If you want to specify individual counters please use the System.Private[counter1, counter2,...] syntax. For example, to display just the gc-heap-counter, use:
+
+> ```bash
+> dotnet-counters monitor System.Runtime[gc-heap-size] --refresh-interval 1 -p 4923
+> ```
+
+At this point, we can safely say that memory is leaking (or at the very least is growing and doesn't seem to come back down once request is finished). The next step is now to run a collection tool that can help us collect the right data for memory analysis.
+
+
+### Core dump generation
+Most commonly when analyzing possible memory leaks, we need access to as much of the apps memory as possible. We can then analyze the memory contents and relationships between objects to create theories on why memory is not being freed. A very common diagnostics data source is a memory dump (Win) and the equivalent core dump (on Linux). In order to generate a core dump of a .net core application, we can use the dotnet-dump tool (please see 'Installing the diagnostics tools' section). Using the previous webapi run, run the following command to generate a core dump:
+
+> ```bash
+> sudo ./dotnet-dump collect -p 4807
+> ```
+
+4807 is the process identifier which can be found using dotnet-trace list-processes. The result is a core dump located in the same folder. Please note that to generate core dumps, dotnet-dump requires sudo.
+
+
+### Analyzing the core dump
+Now that we have a core dump generated, what options do we have to analyze the core dump? On Windows, we would typically use a combination of WinDBG and SOS and the same strategy applies to Linux (albeit with a different tool set). On Linux, there are a couple of different options with some caveats:
+
+* LLDB/SOS. LLDB is the Linux debugger that must be used when debugging using SOS.
+* dotnet-dump analyze <dump_path> provides an SOS REPL experience on the specified core file.
+
+In both cases, you have to be careful to roughly match the environment up with the production server. For example, if I am running .net core preview 5 on Ubuntu 16.04 the core dump must be analyzed on the same architecture and environment.
+
+For the LLDB/SOS experience, please see - https://github.com/dotnet/coreclr/blob/master/Documentation/building/debugging-instructions.md.
+
+To use the dotnet-dump tool to analyze the dump please run:
+
+> ```bash
+> dotnet-dump analyze core_20190430_185145
+> ```
+(where core_20190430_185145 is the name of the core dump you want to analyze)
+
+Note: If you see an error complaining that libdl.so cannot be found, you may have to install the libc6-dev package.
+
+You will be presented with a prompt where you can enter SOS commands. Commonly, the first thing we want to look at is the overall state of the managed heap by running:
+
+> ```bash
+> dumpheap -stat
+> ```
+
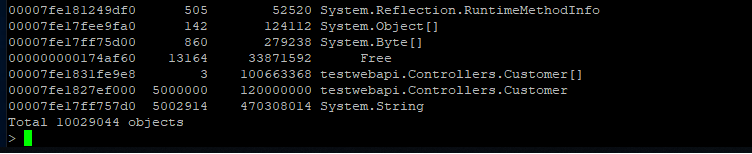
+The (partial) output can be seen below:
+
+
+
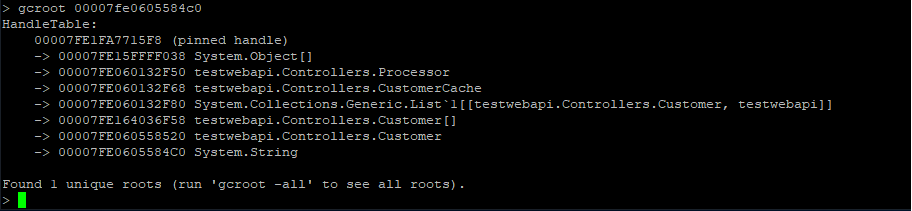
+Here we can see that we have quite a few strings laying around (as well as instances of Customer and Customer[]). We can now use the gcroot command on one of the string instances to see how/why the object is rooted:
+
+
+
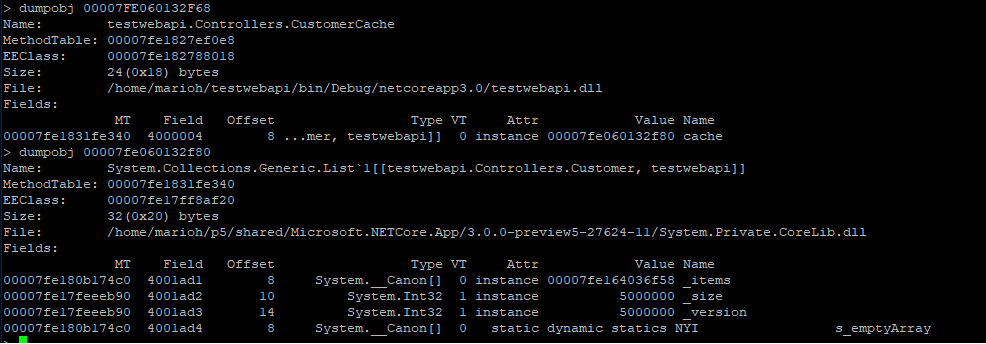
+The string instance appears to be rooted from top level Processor object which in turn references a cache. We can continue dumping out objects to see how much the cache is holding on to:
+
+
+
+From here we can now try and back-track (from code) why the cache seems to be growing in an unbound fashion.
+
+
+
+
+
+
--- /dev/null
+# App is running slow (due to high CPU)
+
+http://localhost:5000/api/diagscenario/highcpu/{milliseconds}
+
+In this scenario, the endpoint will consume substantial amount of CPU for a duration specified by {milliseconds}. In order to diagnose this scenario, we need several key pieces of diagnostics data.
+
+### CPU counters
+Before we dig into collecting diagnostics data to help us root cause this scenario, we need to convince ourselves that what we are actually seeing is a high CPU condition. On Windows we could use the myriad of .NET performance counters, but what about on Linux? It turns out .net core has been instrumented to expose metrics from the runtime and we can use the dotnet-counters tool to get at this information (please see 'Installing the diagnostics tools' section).
+
+Lets run the webapi (dotnet run) and before hitting the above URL that will cause the high CPU condition, lets check our CPU counters:
+
+> ```bash
+> dotnet-counters monitor --refresh-interval 1 -p 22884
+> ```
+
+22884 is the process identifier which can be found using dotnet-trace list-processes. The refresh-interval is the number of seconds before refreshes.
+
+The output should be similar to the below:
+
+
+
+Here we can see that right after startup, the CPU is not being consumed at all (0%).
+
+Now, let's hit the URL (http://localhost:5000/api/diagscenario/highcpu/60000)
+
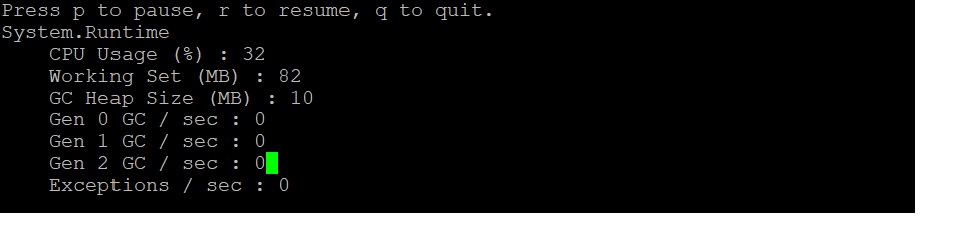
+Re-run the dotnet-counters command. We should see an increase in CPU usage as shown below:
+
+
+
+Throughout the execution of that request, CPU hovers at around 30%.
+
+Note that this shows all the counters. If you want to specify individual counters please use the System.Private[counter1, counter2,...] syntax. For example, to display just the gc-heap-counter, use:
+
+> ```bash
+> dotnet-counters monitor System.Runtime[cpu-usage] -p 22884 --refresh-interval 1
+> ```
+
+At this point, we can safely say that CPU is running a little hotter than we expect. The next step is now to run a collection tool that can help us collect the right data for the CPU analysis.
+
+
+### Trace generation
+Commonly when analyzing slow request (such as due to high CPU), we need a diagnostics tool that can give us insight into what our code is doing at frequent intervals. A very common diagnostics data source is a profiler. There are a few different options in terms of profilers and depending on which platform you plan on analyzing the trace data on.
+
+
+#### If you plan on capturing trace data that can be viewed on a Windows machine...
+In order to generate profiler traces of a .net core application, we can use the dotnet-trace tool (please see 'Installing the diagnostics tools' section). Using the previous webapi, hit the URL (http://localhost:5000/api/diagscenario/highcpu/60000) again and while its running within the 1 minute request, run the following:
+
+> ```bash
+> dotnet-trace collect -p 2266 --providers Microsoft-DotNETCore-SampleProfiler
+> ```
+
+2266 is the process identifier which can be found using dotnet-trace list-processes. Let dotnet-trace run for about 20-30 seconds and then hit enter to exit the collection. The result is a netperf file located in the same folder. netperf files are a great way to use existing analysis tools on Windows (such as PerfView) to diagose performance problems.
+
+Alternatively, you can get the perf and LTTng trace data in netperf format by using the perfcollect tool (please see Installing the tools section). Once installed, run the following command:
+
+> ```bash
+> sudo ./perfcollect collect sampleTrace
+> ```
+
+Reproduce the problem and when done, hit CTRL-C to exit the perfcollect tool. You will see a sampleTrace.trace.zip file that you can view using Perfview on a Windows machine.
+
+
+#### If you plan on capturing trace data that can be viewed on a Linux machine...
+If you are more familiar with existing performance tools on Linux, .net core is also instrumented to allow you to make use of those tools. Here, we will illustrate how you can use the 'perf' tool to generate traces that can be used on Linux to diagnose performance problems. Exit the previous instance of the webapi and set the following in the terminal:
+
+> ```bash
+> export COMPlus_PerfMapEnabled=1
+> ```
+
+Next, re-launch the webapi. This step is required to get more legible frames in the traces.
+
+In the same terminal, run the webapi again, hit the URL (http://localhost:5000/api/diagscenario/highcpu/60000) again and while its running within the 1 minute request, run the following:
+
+> ```bash
+> sudo perf record -p 2266 -g
+> ```
+
+This will start the perf collection process. Let it run for about 20-30 seconds and then hit CTRL-C to exit the collection process. The output should tell you how many MBs of perf data was written.
+
+### Analyzing the trace
+When it comes to analyzing the profiler trace generated in the previous step, you have two options depending on if you generated a netperf file or used the native perf command in Linux.
+
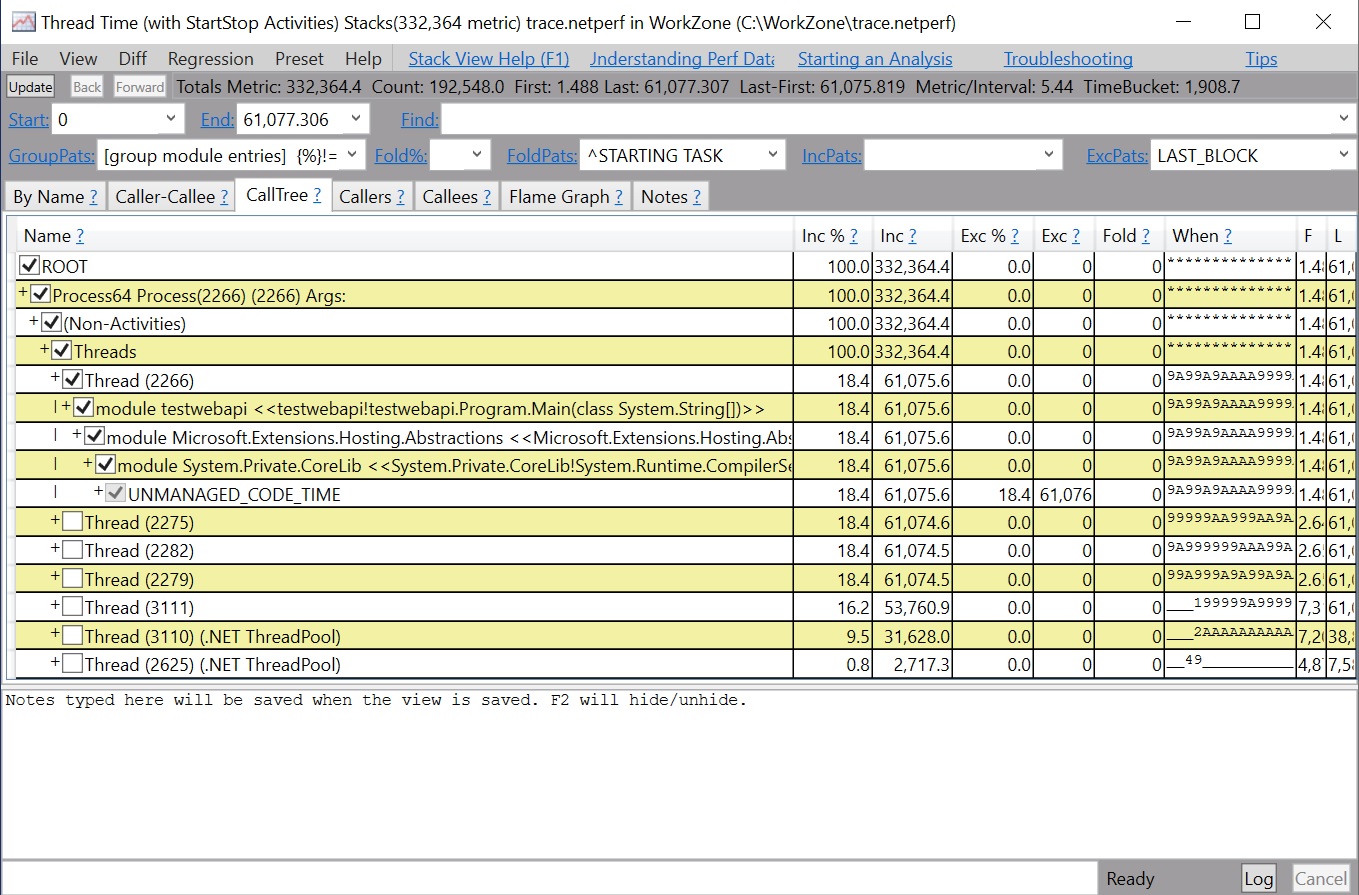
+Starting with the netperf file, you need to transfer the netperf file to a Windows machine and use PerfView to analyze the trace as shown below.
+
+
+
+If you generated the traces using the Linux perf command, you can use the same perf command to see the output of the trace.
+
+> ```bash
+> sudo perf report -f
+> ```
+
+Alternatively, you can also generate a flamegrah by using the following commands:
+
+> ```bash
+> git clone --depth=1 https://github.com/BrendanGregg/FlameGraph
+> sudo perf script | FlameGraph/stackcollapse-perf.pl | FlameGraph/flamegraph.pl > flamegraph.svg
+> ```
+
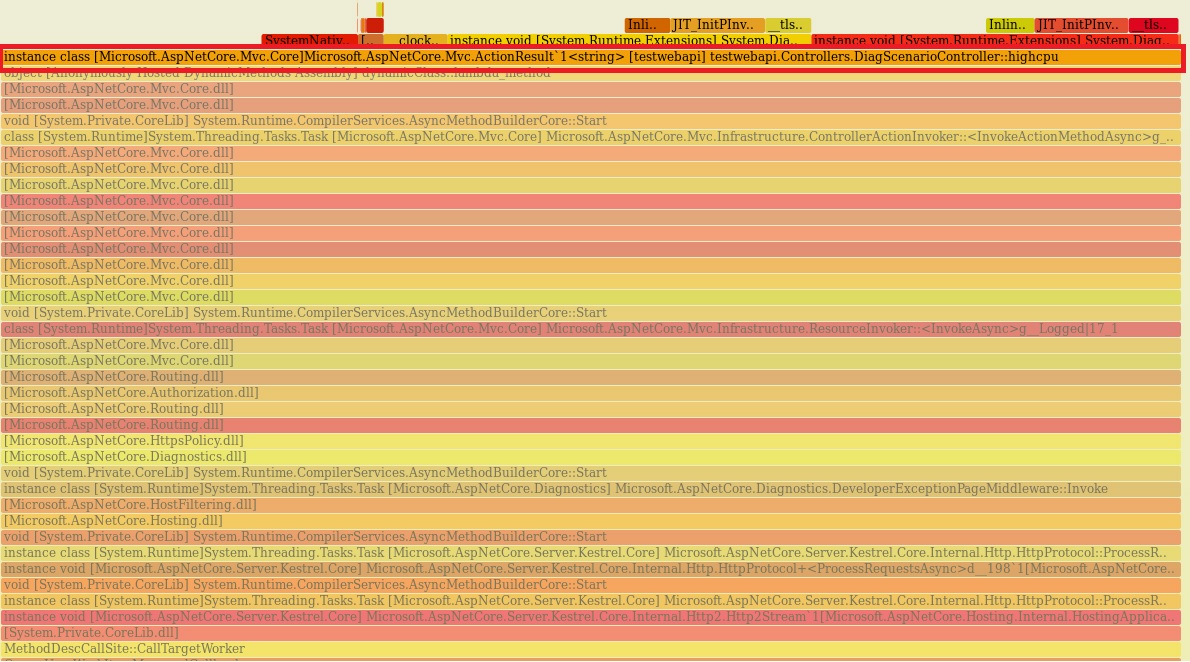
+This will generate a flamegraph.svg that you can view in the browser to investigate the performance problem:
+
+
+
+
+
+
+
--- /dev/null
+using System;
+using System.Diagnostics;
+using System.Collections.Generic;
+using System.Linq;
+using System.Threading.Tasks;
+using Microsoft.AspNetCore.Mvc;
+
+namespace testwebapi.Controllers
+{
+ [Route("api/[controller]")]
+ [ApiController]
+ public class DiagScenarioController : ControllerBase
+ {
+
+ private static Processor p = new Processor();
+
+ [HttpGet]
+ [Route("memleak/{kb}")]
+ public ActionResult<string> memleak(int kb)
+ {
+
+ int it = (kb*1000) / 100;
+ for(int i=0; i<it; i++)
+ {
+ p.ProcessTransaction(new Customer(Guid.NewGuid().ToString()));
+ }
+
+
+ return "success:memleak";
+ }
+
+ [HttpGet]
+ [Route("exception")]
+ public ActionResult<string> exception()
+ {
+
+ throw new Exception("bad, bad code");
+ }
+
+
+ [HttpGet]
+ [Route("highcpu/{milliseconds}")]
+ public ActionResult<string> highcpu(int milliseconds)
+ {
+ Stopwatch watch=new Stopwatch();
+ watch.Start();
+
+ while (true)
+ {
+ watch.Stop();
+ if(watch.ElapsedMilliseconds > milliseconds)
+ break;
+ watch.Start();
+ }
+
+
+ return "success:highcpu";
+ }
+
+ }
+
+ class Customer
+ {
+ private string id;
+
+ public Customer(string id)
+ {
+ this.id = id;
+ }
+ }
+
+ class CustomerCache
+ {
+ private List<Customer> cache = new List<Customer>();
+
+ public void AddCustomer(Customer c)
+ {
+ cache.Add(c);
+ }
+ }
+
+ class Processor
+ {
+ private CustomerCache cache = new CustomerCache();
+
+ public void ProcessTransaction(Customer customer)
+ {
+ cache.AddCustomer(customer);
+ }
+ }
+
+
+}
--- /dev/null
+# Installing the diagnostics tools
+
+Depending on the diagnostics scenario you will use one or more of the tools below to get to root cause. By default, these tools are installed to ~/.dotnet/tools.
+
+### dotnet-counters
+In the .NET full/Windows world, we have a myriad of performance counters that can be used to triage and diagnose production issues. For .Net core we have a similar and cross platform story centered around a tool called dotnet-counters. To install the tool, run the following command:
+
+> ```bash
+> dotnet tool install --global dotnet-counters --version 1.0.3-preview5.19251.2
+> ```
+
+
+### dotnet-trace
+.NET core includes what is called the 'EventPipe' through which diagnostics data is exposed. The dotnet-trace tool allows you to consume interesting profiling data from your app that can help in scenarios where you need to root cause apps running slow. To install the tool, run the following command:
+
+> ```bash
+> dotnet tool install --global dotnet-trace --version 1.0.3-preview5.19251.2
+> ```
+
+Please note, the dotnet-trace tool is version independent but as of right now (preview 5) it requires the 2.1 runtime to be installed to work. This will be fixed moving forward.
+
+
+### dotnet-dump
+In order to generate core dumps for .net core apps, you can use the dotnet-dump tool. To install the tool, run the following command:
+
+> ```bash
+> dotnet tool install --global dotnet-dump --version 1.0.3-preview5.19251.2
+> ```
+
+Please note, the dotnet-trace tool is version independent but as of right now (preview 5) it requires the 2.1 runtime to be installed to work. This will be fixed moving forward.
+
+
+### dotnet-symbol
+In order to debug core dumps, the correct symbols need to be available. The dotnet-symbol tool allows you to point to a core dump and it will automatically download the symbols for you. To install the tool, run:
+
+> ```bash
+> dotnet tool install -g dotnet-symbol
+> ```
+
+### perfcollect
+Thet .NET core runtime is instrumented for both perf and LTTng. To facilitate easier collection of both tracing technologies there is a tool called perfcollect. Perfcollect will output the joint trace data into a netperf file that can be analyzed using PerfView on Windows. To install the tool run the following commands:
+
+> ```
+> curl -OL http://aka.ms/perfcollect
+> chmod +x perfcollect
+> sudo ./perfcollect install
+> ```
+
+++ /dev/null
-# .NET Core Diagnostics Overview
-
-With .NET Full running on Windows we have grown accustomed to a plethora of great diagnostics tools ranging from dump generation and manual analysis to more sophisticated collection engines such as DebugDiag. As .NET core is picking up (cross platform) steam what types of diagnostics capabilities are available to us when we need to do production diagnostics? It turns out that a lot of work has been done in this area and specifically .net core 3 promises to bring a wide range of diagnostics capabilities.
-
-To learn more about production diagnostics in .net core 3, we'll be running through a set of diagnostics scenarios using the built in runtime/sdk tools. The walkthrougs are all run on Ubuntu 16.04 and use the latest .net core preview bits.
-
-Before we jump in head first, let's take a look at some basic methodoligies as it relates to production diagnostics. When an outage occurs in production, typically the first and foremost goal is mitigation. Mitigation typically involves getting the app back up and running as quickly as possible. Common mitigation techniques involve restarting the app or sometimes one or more nodes/servers. While restarting is a quick and effective mitigation technique, root cause of the failure is still expected to be understood and appropriate fix(es) made to avoid future downtime. In order to get to root cause, we need to collect as much diagnostics data as we can prior to executing the mitigation strategy. The diagnostics data collected can then be analyzed postmortem to determine root cause and possible fixes. Each of the scenarios we will explore here will outline what capabilities .net core 3 has in terms of diagnostics data collection and analysis.
-
-Below is the list of (growing) scenarios that will be covered.
-
-
-Most of the scenarios below are implemented using a simple webapi with methods that expose each particular scenario. You can easily create the webapi using:
-
-* dotnet new webapi
-* add diagsenario.cs to your Controllers folder
-* dotnet build
-
-Please note that you have to be using at least preview 5 for most of the capabilities to work.
-
-
-### [Installing the diagnostics tools](https://github.com/MarioHewardt/netcorediag/blob/master/installing_the_diagnostics_tools.md)
-
-### [Scenario - App is leaking memory (eventual crash)](https://github.com/MarioHewardt/netcorediag/blob/master/app_is_leaking_memory_eventual_crash.md)
-
-### [Scenario - App is running slow (due to high CPU)](https://github.com/MarioHEwardt/netcorediag/blob/master/app_running_slow_highcpu.md)
-
-### Scenario - App is experiencing intermittent exceptions
-
-
-
-
+++ /dev/null
-# App is leaking memory (eventual crash/hang)
-
-http://localhost:5000/api/diagscenario/memleak/{kb}
-
-In this scenario, the endpoint will slowly start leaking memory (amount specified by {kb}) and eventually will result in an out of memory exception. In order to diagnose this scenario, we need several key pieces of diagnostics data.
-
-### Memory counters
-Before we dig into collecting diagnostics data to help us root cause this scenario, we need to convince ourselves that what we are actually seeing is a memory leak (memory growth). On Windows we could use the myriad of .NET performance counters, but what about on Linux? It turns out .net core has been instrumented to expose metrics from the runtime and we can use the dotnet-counters tool to get at this information (please see 'Installing the diagnostics tools' section).
-
-Next, lets run the webapi (dotnet run) and before hitting the above URL that will cause the leak, lets check our managed memory counters:
-
-> ```bash
-> dotnet-counters monitor gc-heap-size --refresh-interval 1 -p 4807
-> ```
-
-4807 is the process identifier which can be found using dotnet-trace list-processes. The refresh-interval is the number of seconds before refreshes.
-
-The output should be similar to the below:
-
-
-
-Here we can see that right after startup, the managed heap memory is 4MB.
-
-Now, let's hit the URL (http://localhost:5000/api/diagscenario/memleak/200000)
-
-Re-run the dotnet-counters command. We should see an increase in memory usage as shown below:
-
-
-
-Memory has now grown to around 265MB.
-
-Note that this shows all the counters. If you want to specify individual counters please use the System.Private[counter1, counter2,...] syntax. For example, to display just the gc-heap-counter, use:
-
-> ```bash
-> dotnet-counters monitor System.Runtime[gc-heap-size] --refresh-interval 1 -p 4923
-> ```
-
-At this point, we can safely say that memory is leaking (or at the very least is growing and doesn't seem to come back down once request is finished). The next step is now to run a collection tool that can help us collect the right data for memory analysis.
-
-
-### Core dump generation
-Most commonly when analyzing possible memory leaks, we need access to as much of the apps memory as possible. We can then analyze the memory contents and relationships between objects to create theories on why memory is not being freed. A very common diagnostics data source is a memory dump (Win) and the equivalent core dump (on Linux). In order to generate a core dump of a .net core application, we can use the dotnet-dump tool (please see 'Installing the diagnostics tools' section). Using the previous webapi run, run the following command to generate a core dump:
-
-> ```bash
-> sudo ./dotnet-dump collect -p 4807
-> ```
-
-4807 is the process identifier which can be found using dotnet-trace list-processes. The result is a core dump located in the same folder. Please note that to generate core dumps, dotnet-dump requires sudo.
-
-
-### Analyzing the core dump
-Now that we have a core dump generated, what options do we have to analyze the core dump? On Windows, we would typically use a combination of WinDBG and SOS and the same strategy applies to Linux (albeit with a different tool set). On Linux, there are a couple of different options with some caveats:
-
-* LLDB/SOS. LLDB is the Linux debugger that must be used when debugging using SOS.
-* dotnet-dump analyze <dump_path> provides an SOS REPL experience on the specified core file.
-
-In both cases, you have to be careful to roughly match the environment up with the production server. For example, if I am running .net core preview 5 on Ubuntu 16.04 the core dump must be analyzed on the same architecture and environment.
-
-For the LLDB/SOS experience, please see - https://github.com/dotnet/coreclr/blob/master/Documentation/building/debugging-instructions.md.
-
-To use the dotnet-dump tool to analyze the dump please run:
-
-> ```bash
-> dotnet-dump analyze core_20190430_185145
-> ```
-(where core_20190430_185145 is the name of the core dump you want to analyze)
-
-Note: If you see an error complaining that libdl.so cannot be found, you may have to install the libc6-dev package.
-
-You will be presented with a prompt where you can enter SOS commands. Commonly, the first thing we want to look at is the overall state of the managed heap by running:
-
-> ```bash
-> dumpheap -stat
-> ```
-
-The (partial) output can be seen below:
-
-
-
-Here we can see that we have quite a few strings laying around (as well as instances of Customer and Customer[]). We can now use the gcroot command on one of the string instances to see how/why the object is rooted:
-
-
-
-The string instance appears to be rooted from top level Processor object which in turn references a cache. We can continue dumping out objects to see how much the cache is holding on to:
-
-
-
-From here we can now try and back-track (from code) why the cache seems to be growing in an unbound fashion.
-
-
-
-
-
-
+++ /dev/null
-# App is running slow (due to high CPU)
-
-http://localhost:5000/api/diagscenario/highcpu/{milliseconds}
-
-In this scenario, the endpoint will consume substantial amount of CPU for a duration specified by {milliseconds}. In order to diagnose this scenario, we need several key pieces of diagnostics data.
-
-### CPU counters
-Before we dig into collecting diagnostics data to help us root cause this scenario, we need to convince ourselves that what we are actually seeing is a high CPU condition. On Windows we could use the myriad of .NET performance counters, but what about on Linux? It turns out .net core has been instrumented to expose metrics from the runtime and we can use the dotnet-counters tool to get at this information (please see 'Installing the diagnostics tools' section).
-
-Lets run the webapi (dotnet run) and before hitting the above URL that will cause the high CPU condition, lets check our CPU counters:
-
-> ```bash
-> dotnet-counters monitor --refresh-interval 1 -p 22884
-> ```
-
-22884 is the process identifier which can be found using dotnet-trace list-processes. The refresh-interval is the number of seconds before refreshes.
-
-The output should be similar to the below:
-
-
-
-Here we can see that right after startup, the CPU is not being consumed at all (0%).
-
-Now, let's hit the URL (http://localhost:5000/api/diagscenario/highcpu/60000)
-
-Re-run the dotnet-counters command. We should see an increase in CPU usage as shown below:
-
-
-
-Throughout the execution of that request, CPU hovers at around 30%.
-
-Note that this shows all the counters. If you want to specify individual counters please use the System.Private[counter1, counter2,...] syntax. For example, to display just the gc-heap-counter, use:
-
-> ```bash
-> dotnet-counters monitor System.Runtime[cpu-usage] -p 22884 --refresh-interval 1
-> ```
-
-At this point, we can safely say that CPU is running a little hotter than we expect. The next step is now to run a collection tool that can help us collect the right data for the CPU analysis.
-
-
-### Trace generation
-Commonly when analyzing slow request (such as due to high CPU), we need a diagnostics tool that can give us insight into what our code is doing at frequent intervals. A very common diagnostics data source is a profiler. There are a few different options in terms of profilers and depending on which platform you plan on analyzing the trace data on.
-
-
-#### If you plan on capturing trace data that can be viewed on a Windows machine...
-In order to generate profiler traces of a .net core application, we can use the dotnet-trace tool (please see 'Installing the diagnostics tools' section). Using the previous webapi, hit the URL (http://localhost:5000/api/diagscenario/highcpu/60000) again and while its running within the 1 minute request, run the following:
-
-> ```bash
-> dotnet-trace collect -p 2266 --providers Microsoft-DotNETCore-SampleProfiler
-> ```
-
-2266 is the process identifier which can be found using dotnet-trace list-processes. Let dotnet-trace run for about 20-30 seconds and then hit enter to exit the collection. The result is a netperf file located in the same folder. netperf files are a great way to use existing analysis tools on Windows (such as PerfView) to diagose performance problems.
-
-Alternatively, you can get the perf and LTTng trace data in netperf format by using the perfcollect tool (please see Installing the tools section). Once installed, run the following command:
-
-> ```bash
-> sudo ./perfcollect collect sampleTrace
-> ```
-
-Reproduce the problem and when done, hit CTRL-C to exit the perfcollect tool. You will see a sampleTrace.trace.zip file that you can view using Perfview on a Windows machine.
-
-
-#### If you plan on capturing trace data that can be viewed on a Linux machine...
-If you are more familiar with existing performance tools on Linux, .net core is also instrumented to allow you to make use of those tools. Here, we will illustrate how you can use the 'perf' tool to generate traces that can be used on Linux to diagnose performance problems. Exit the previous instance of the webapi and set the following in the terminal:
-
-> ```bash
-> export COMPlus_PerfMapEnabled=1
-> ```
-
-Next, re-launch the webapi. This step is required to get more legible frames in the traces.
-
-In the same terminal, run the webapi again, hit the URL (http://localhost:5000/api/diagscenario/highcpu/60000) again and while its running within the 1 minute request, run the following:
-
-> ```bash
-> sudo perf record -p 2266 -g
-> ```
-
-This will start the perf collection process. Let it run for about 20-30 seconds and then hit CTRL-C to exit the collection process. The output should tell you how many MBs of perf data was written.
-
-### Analyzing the trace
-When it comes to analyzing the profiler trace generated in the previous step, you have two options depending on if you generated a netperf file or used the native perf command in Linux.
-
-Starting with the netperf file, you need to transfer the netperf file to a Windows machine and use PerfView to analyze the trace as shown below.
-
-
-
-If you generated the traces using the Linux perf command, you can use the same perf command to see the output of the trace.
-
-> ```bash
-> sudo perf report -f
-> ```
-
-Alternatively, you can also generate a flamegrah by using the following commands:
-
-> ```bash
-> git clone --depth=1 https://github.com/BrendanGregg/FlameGraph
-> sudo perf script | FlameGraph/stackcollapse-perf.pl | FlameGraph/flamegraph.pl > flamegraph.svg
-> ```
-
-This will generate a flamegraph.svg that you can view in the browser to investigate the performance problem:
-
-
-
-
-
-
-
+++ /dev/null
-using System;
-using System.Diagnostics;
-using System.Collections.Generic;
-using System.Linq;
-using System.Threading.Tasks;
-using Microsoft.AspNetCore.Mvc;
-
-namespace testwebapi.Controllers
-{
- [Route("api/[controller]")]
- [ApiController]
- public class DiagScenarioController : ControllerBase
- {
-
- private static Processor p = new Processor();
-
- [HttpGet]
- [Route("memleak/{kb}")]
- public ActionResult<string> memleak(int kb)
- {
-
- int it = (kb*1000) / 100;
- for(int i=0; i<it; i++)
- {
- p.ProcessTransaction(new Customer(Guid.NewGuid().ToString()));
- }
-
-
- return "success:memleak";
- }
-
- [HttpGet]
- [Route("exception")]
- public ActionResult<string> exception()
- {
-
- throw new Exception("bad, bad code");
- }
-
-
- [HttpGet]
- [Route("highcpu/{milliseconds}")]
- public ActionResult<string> highcpu(int milliseconds)
- {
- Stopwatch watch=new Stopwatch();
- watch.Start();
-
- while (true)
- {
- watch.Stop();
- if(watch.ElapsedMilliseconds > milliseconds)
- break;
- watch.Start();
- }
-
-
- return "success:highcpu";
- }
-
- }
-
- class Customer
- {
- private string id;
-
- public Customer(string id)
- {
- this.id = id;
- }
- }
-
- class CustomerCache
- {
- private List<Customer> cache = new List<Customer>();
-
- public void AddCustomer(Customer c)
- {
- cache.Add(c);
- }
- }
-
- class Processor
- {
- private CustomerCache cache = new CustomerCache();
-
- public void ProcessTransaction(Customer customer)
- {
- cache.AddCustomer(customer);
- }
- }
-
-
-}
+++ /dev/null
-# Installing the diagnostics tools
-
-Depending on the diagnostics scenario you will use one or more of the tools below to get to root cause. By default, these tools are installed to ~/.dotnet/tools.
-
-### dotnet-counters
-In the .NET full/Windows world, we have a myriad of performance counters that can be used to triage and diagnose production issues. For .Net core we have a similar and cross platform story centered around a tool called dotnet-counters. To install the tool, run the following command:
-
-> ```bash
-> dotnet tool install --global dotnet-counters --version 1.0.3-preview5.19228.1 --add-source https://dotnetfeed.blob.core.windows.net/dotnet-core/index.json`
-> ```
-
-
-### dotnet-trace
-.NET core includes what is called the 'EventPipe' through which diagnostics data is exposed. The dotnet-trace tool allows you to consume interesting profiling data from your app that can help in scenarios where you need to root cause apps running slow. To install the tool, run the following command:
-
-> ```bash
-> dotnet tool install --global dotnet-trace --version 1.0.3-preview5.19228.1 --add-source https://dotnetfeed.blob.core.windows.net/dotnet-core/index.json
-> ```
-
-Please note, the dotnet-trace tool is version independent but as of right now (preview 5) it requires the 2.1 runtime to be installed to work. This will be fixed moving forward.
-
-
-### dotnet-dump
-In order to generate core dumps for .net core apps, you can use the dotnet-dump tool. To install the tool, run the following command:
-
-> ```bash
-> dotnet tool install --global dotnet-dump --version 1.0.3-preview5.19228.1 --add-source https://dotnetfeed.blob.core.windows.net/dotnet-core/index.json
-> ```
-
-Please note, the dotnet-trace tool is version independent but as of right now (preview 5) it requires the 2.1 runtime to be installed to work. This will be fixed moving forward.
-
-
-### dotnet-symbol
-In order to debug core dumps, the correct symbols need to be available. The dotnet-symbol tool allows you to point to a core dump and it will automatically download the symbols for you. To install the tool, run:
-
-> ```bash
-> dotnet tool install -g dotnet-symbol
-> ```
-
-### perfcollect
-Thet .NET core runtime is instrumented for both perf and LTTng. To facilitate easier collection of both tracing technologies there is a tool called perfcollect. Perfcollect will output the joint trace data into a netperf file that can be analyzed using PerfView on Windows. To install the tool run the following commands:
-
-> ```
-> curl -OL http://aka.ms/perfcollect
-> chmod +x perfcollect
-> sudo ./perfcollect install
-> ```
-