}
```
-
-
-
-
-
-
-### Analyzing the core dump
-Now that we have a core dump generated, what options do we have to analyze the core dump? On Windows, we would typically use a combination of WinDBG and SOS and the same strategy applies to Linux (albeit with a different tool set). On Linux, there are a couple of different options with some caveats:
-
-* LLDB/SOS. LLDB is the Linux debugger that must be used when debugging using SOS.
-* dotnet-dump analyze <dump_path> provides an SOS REPL experience on the specified core file.
-
-In both cases, you have to be careful to roughly match the environment up with the production server. For example, if I am running .net core preview 5 on Ubuntu 16.04 the core dump must be analyzed on the same architecture and environment.
-
-For the LLDB/SOS experience, please see - https://github.com/dotnet/coreclr/blob/master/Documentation/building/debugging-instructions.md.
-
-To use the dotnet-dump tool to analyze the dump please run:
+We can now build the tool (dotnet build) and run it against our application. Once built, restart the test webapi, get the process id from dotnet-trace and run triggerdump:
> ```bash
-> dotnet-dump analyze core_20190430_185145
+> dotnet-trace list-processes
+> ...
+> 80926 webapi /home/marioh/webapi/bin/Debug/netcoreapp3.0/webapi
+> sudo dotnet triggerdump.dll 80926 500
> ```
-(where core_20190430_185145 is the name of the core dump you want to analyze)
-Note: If you see an error complaining that libdl.so cannot be found, you may have to install the libc6-dev package.
+Please note that triggerdump has to be run with sudo. At this point, you should see triggerdump waiting/monitoring the memory counter. Let's trigger the intermittent memory spike by navigating to:
+
+http://localhost:5000/api/diagscenario/memspike/300
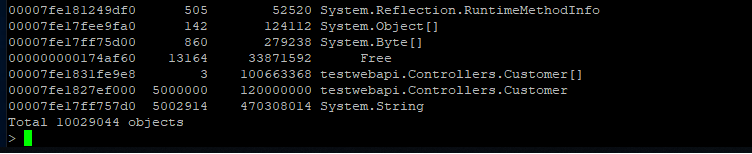
-You will be presented with a prompt where you can enter SOS commands. Commonly, the first thing we want to look at is the overall state of the managed heap by running:
+After 10-15 seconds, you will notice that triggerdump outputs the following followed by exiting.
> ```bash
-> dumpheap -stat
+> ...
+> Writing minidump with heap to file coredump
+> Written 820518912 bytes (200322 pages) to core file
> ```
-The (partial) output can be seen below:
-
-
-
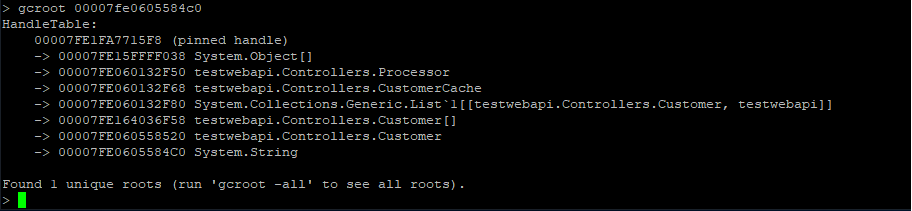
-Here we can see that we have quite a few strings laying around (as well as instances of Customer and Customer[]). We can now use the gcroot command on one of the string instances to see how/why the object is rooted:
-
-
-
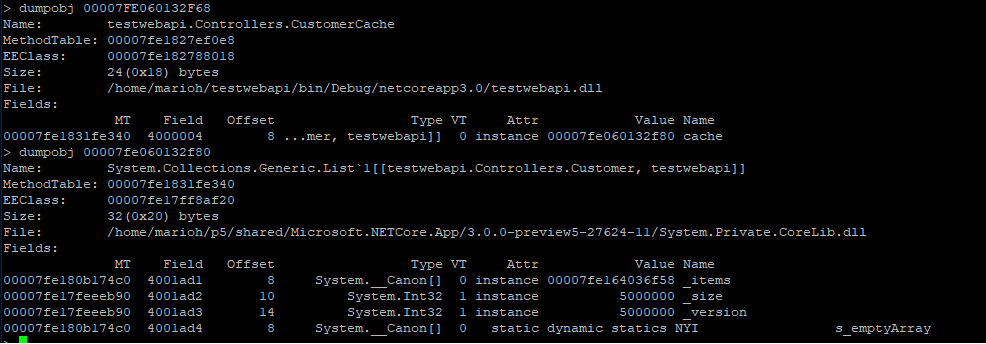
-The string instance appears to be rooted from top level Processor object which in turn references a cache. We can continue dumping out objects to see how much the cache is holding on to:
-
-
-
-From here we can now try and back-track (from code) why the cache seems to be growing in an unbound fashion.
+That's it for creating your own diagnostics tool to support custom scenarios.
+### Analyzing the core dump
+Since the core dump that our tool generates is a standard core dump, we can use the same techniques illustrated in this tutorial to analyze why we're seeing intermitten high memory conditions.